Reports are grouped together in views.
A report contains one or more gadgets, which are the basic tools in the toolkit. When you create a report, you select one or more gadgets to include in the report. See Gadget Types.
When completely defined for your report, each of these gadgets, except for Report Filter, displays statistics about one of these categories:
Agents
Queues
Groups
Campaigns
If multichat is enabled, CCSP Dashboard shows simultaneous calls handled by an agent, which results in reports showing more agents in the Agent-In-Call state (comprising Wrapup, Hold, Ringing, and InCall) than are logged on.
Agent tables and trend charts show current simultaneous calls and current load. Group tables and trend charts show average simultaneous calls per agent and average load per agent.
A report filter assigns filters to multiple tables and charts in the same report.
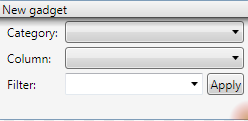
Suppose you have three tables describing campaigns and you want to assign filters to all of them, for example, campaign selection by name. You can do that with the filter gadget.
You select a category and the columns that are the basis of your filter.
CCSP Dashboard applies the filter only to:
Tables in the report that are of the same category and contain the column used as the filter criterion.
Charts in the report that are of the same category and match a category name.
![]()