To add a pie chart to a report:
Right-click in the report window and click Add gadget. The Gadget Builder dialog box appears.
Click Pie chart. The General tab appears.
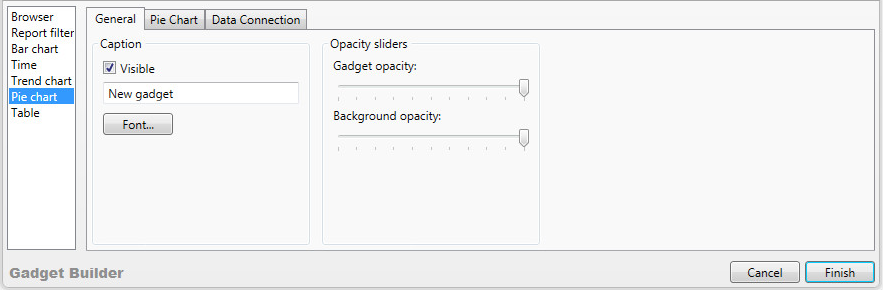
Under Caption:
To display the caption on the chart, select the Visible check box. To hide the caption, clear the Visible check box.
Optionally, type a new caption in the text box and click Font to format it.
Under Opacity sliders, set the Gadget opacity and Background opacity. You increase the opacity by making it less transparent.
Click the Pie Chart tab.
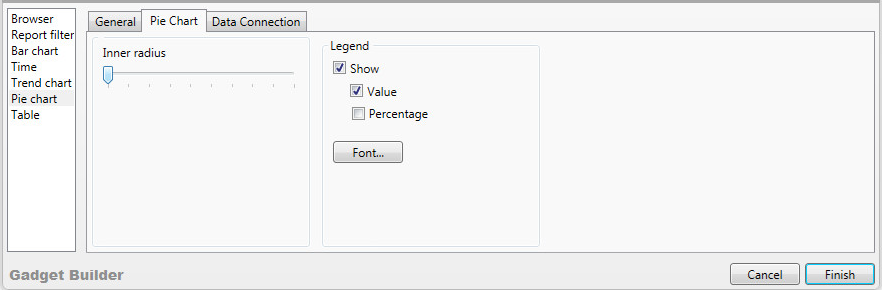
Set the inner radius of the pie chart.
Under Legend, do one of the following:
To hide the legend, clear the Show check box.
To display only the numerical values, select the Show and Value check boxes.
To display only the percentages, select the Show check box, clear the Value check box, and select the Percentage check box.
To display the value and the percentage, select the Show, Value, and Percentage check boxes.
Optionally, click Font to format the legend.
Click the Data Connection tab.
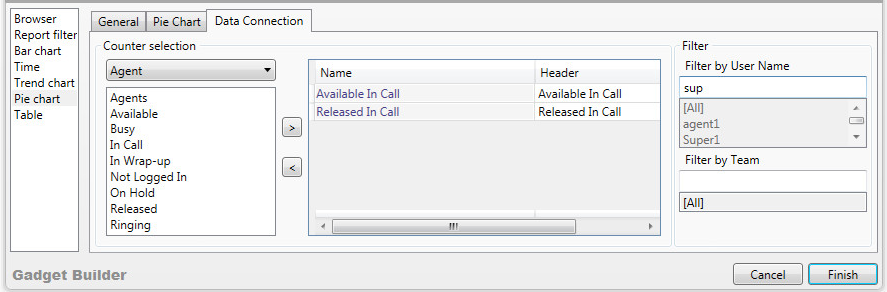
In the Counter selection list, click the category.
In the lower part of the list, click one or more of the statistics. To include or exclude multiple counters, hold down Shift or Ctrl and click the counters.
For details see:
Under Filter, do one of the following:
To filter using regular expressions, type the criterion in the text box. For examples of regular expressions, see Filtering a Table Column.
To filter the data by one item, click the filter.
To select multiple filters, hold down Shift or Ctrl and click the filters.
To avoid filtering, click [All] (the default).
|
|
Note The text box has precedence over the list box. The list box is disabled when the text box is used. If the text box is empty and you select from the list, the text box is disabled. |
Click Finish.
The pie chart appears in the report window.
If you need to rearrange the report window, see To spread out cascaded reports.
|
|
Note Percentage on a pie segment = (The value of the segment) /(sum of the values of all the segments) x 100% |
![]()
